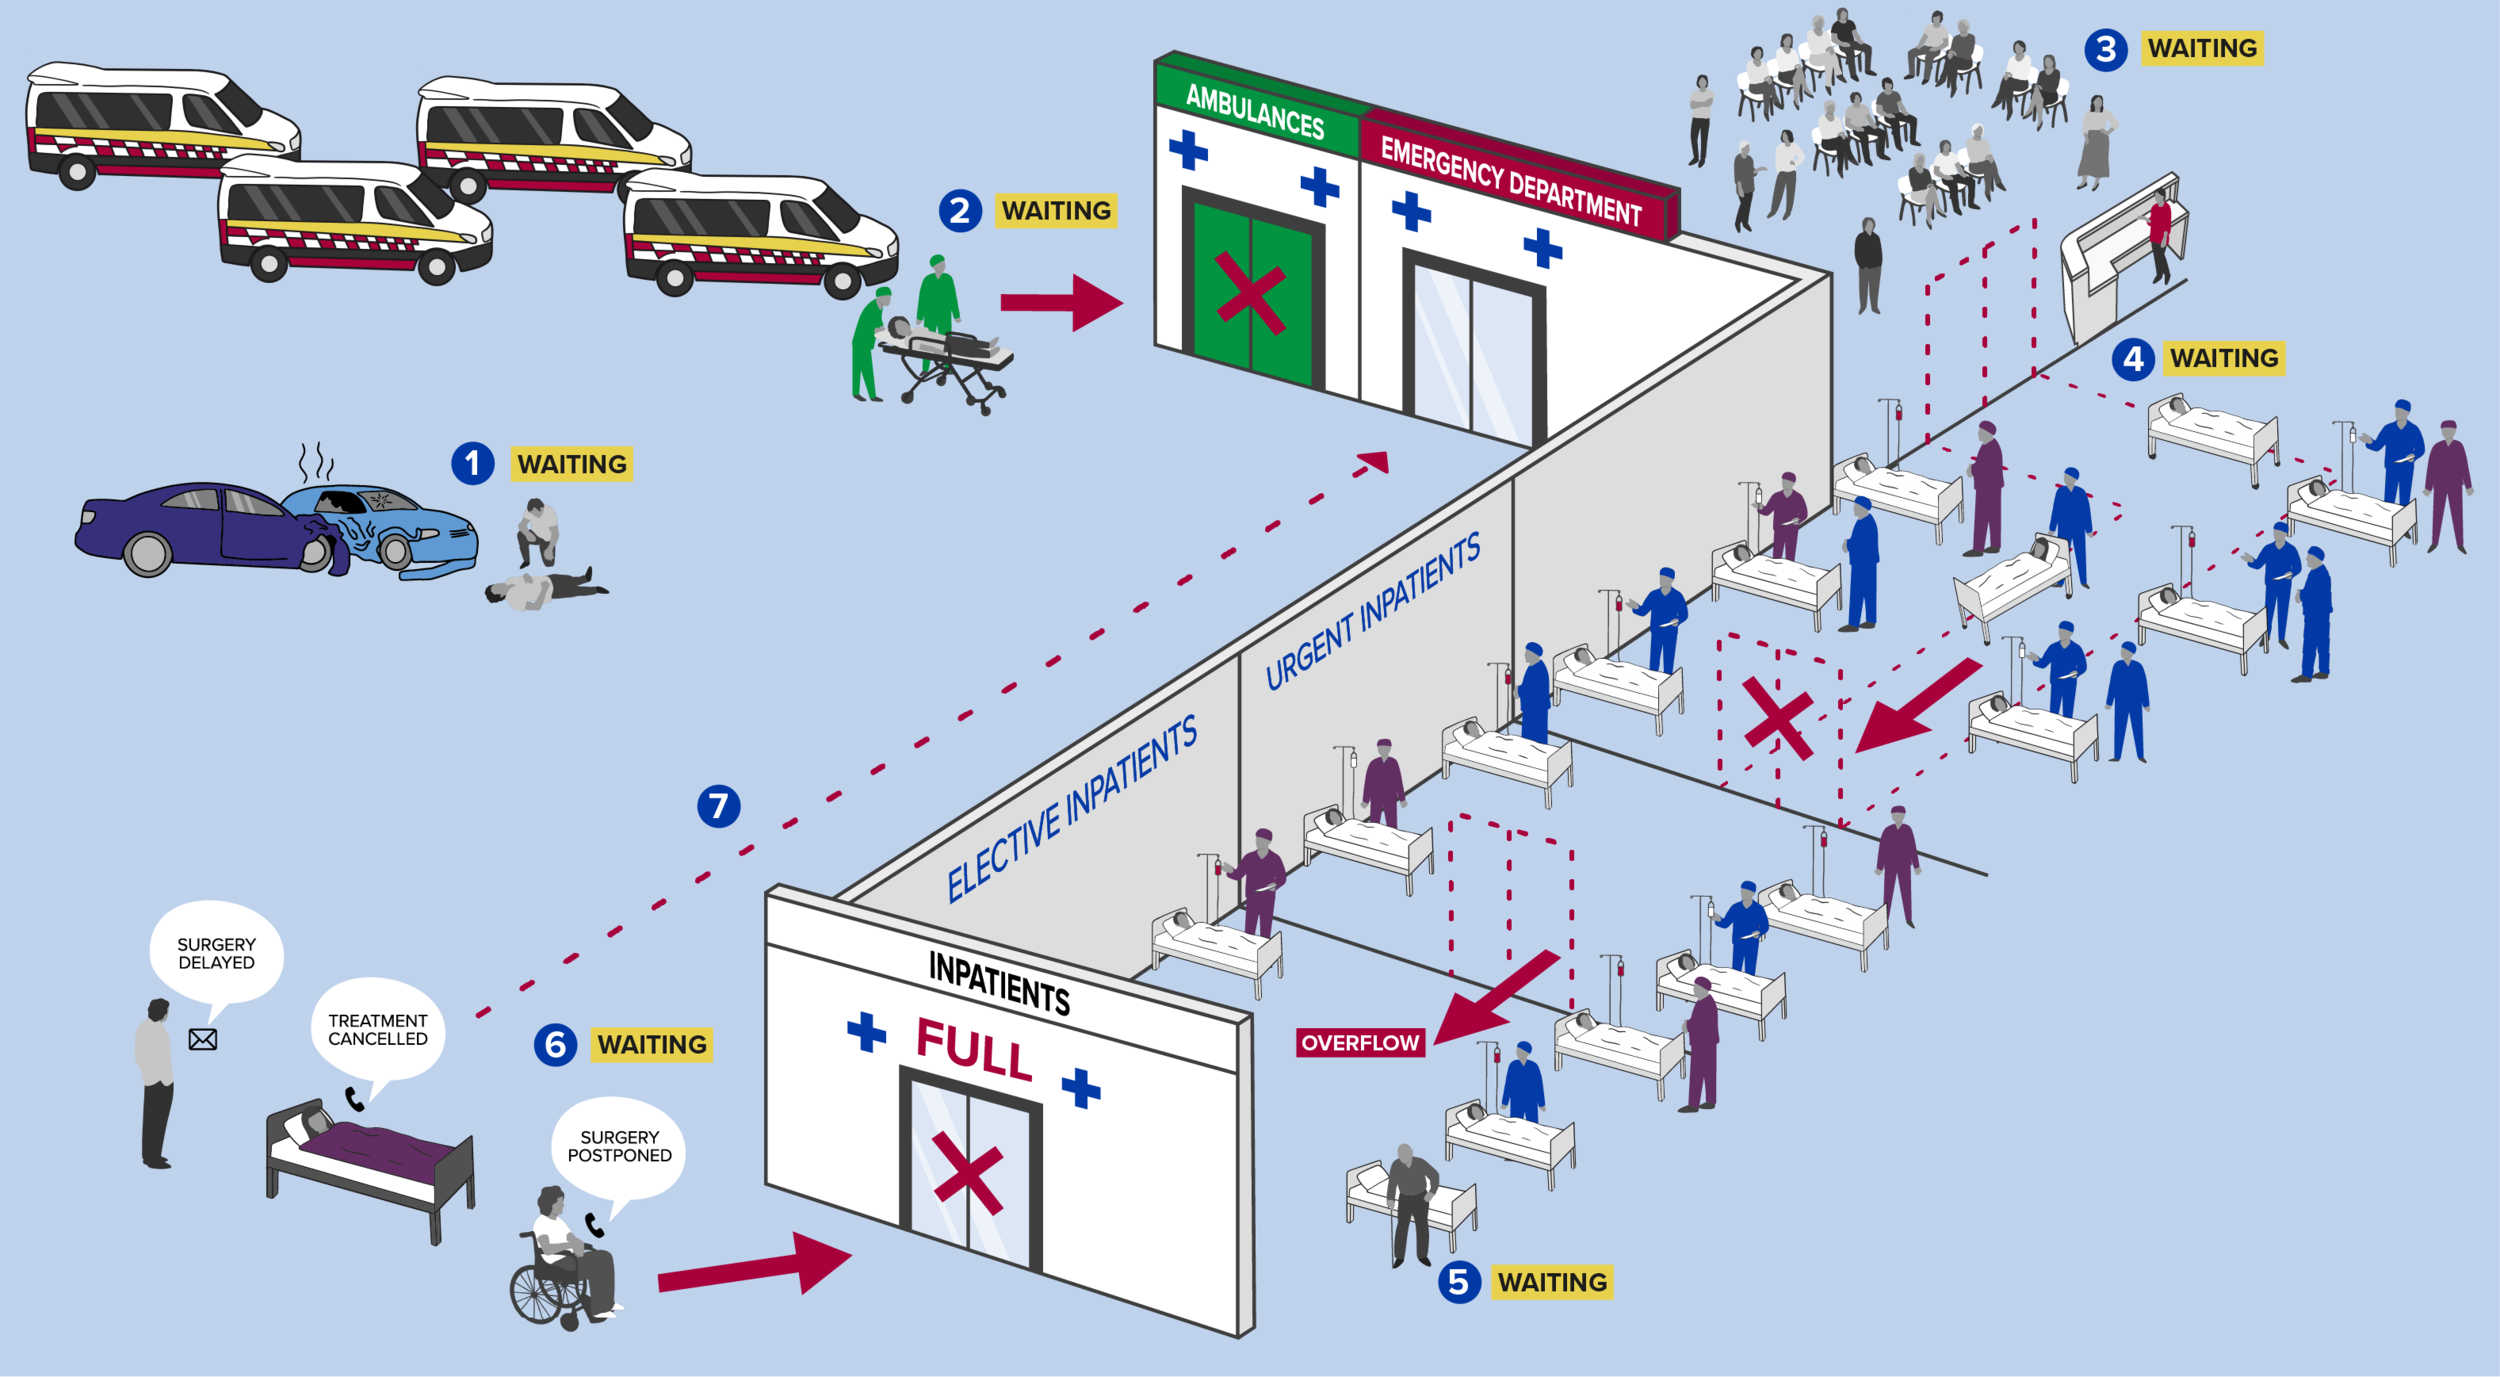
Illustrated Infographic
The Australian Medical Association were creating a report to explain what areas of the hospital systems are creating blockages, as well as how these blockages affect people. My task was to create an infographic which tied in with their branding and previous infographic styles that visually presented this information in an easy to understand way.
The report included stories from medical staff from across Australia, and each number represents a “waiting point” or blockage in the system that correlates to one of the stories.
The full report can be found here.


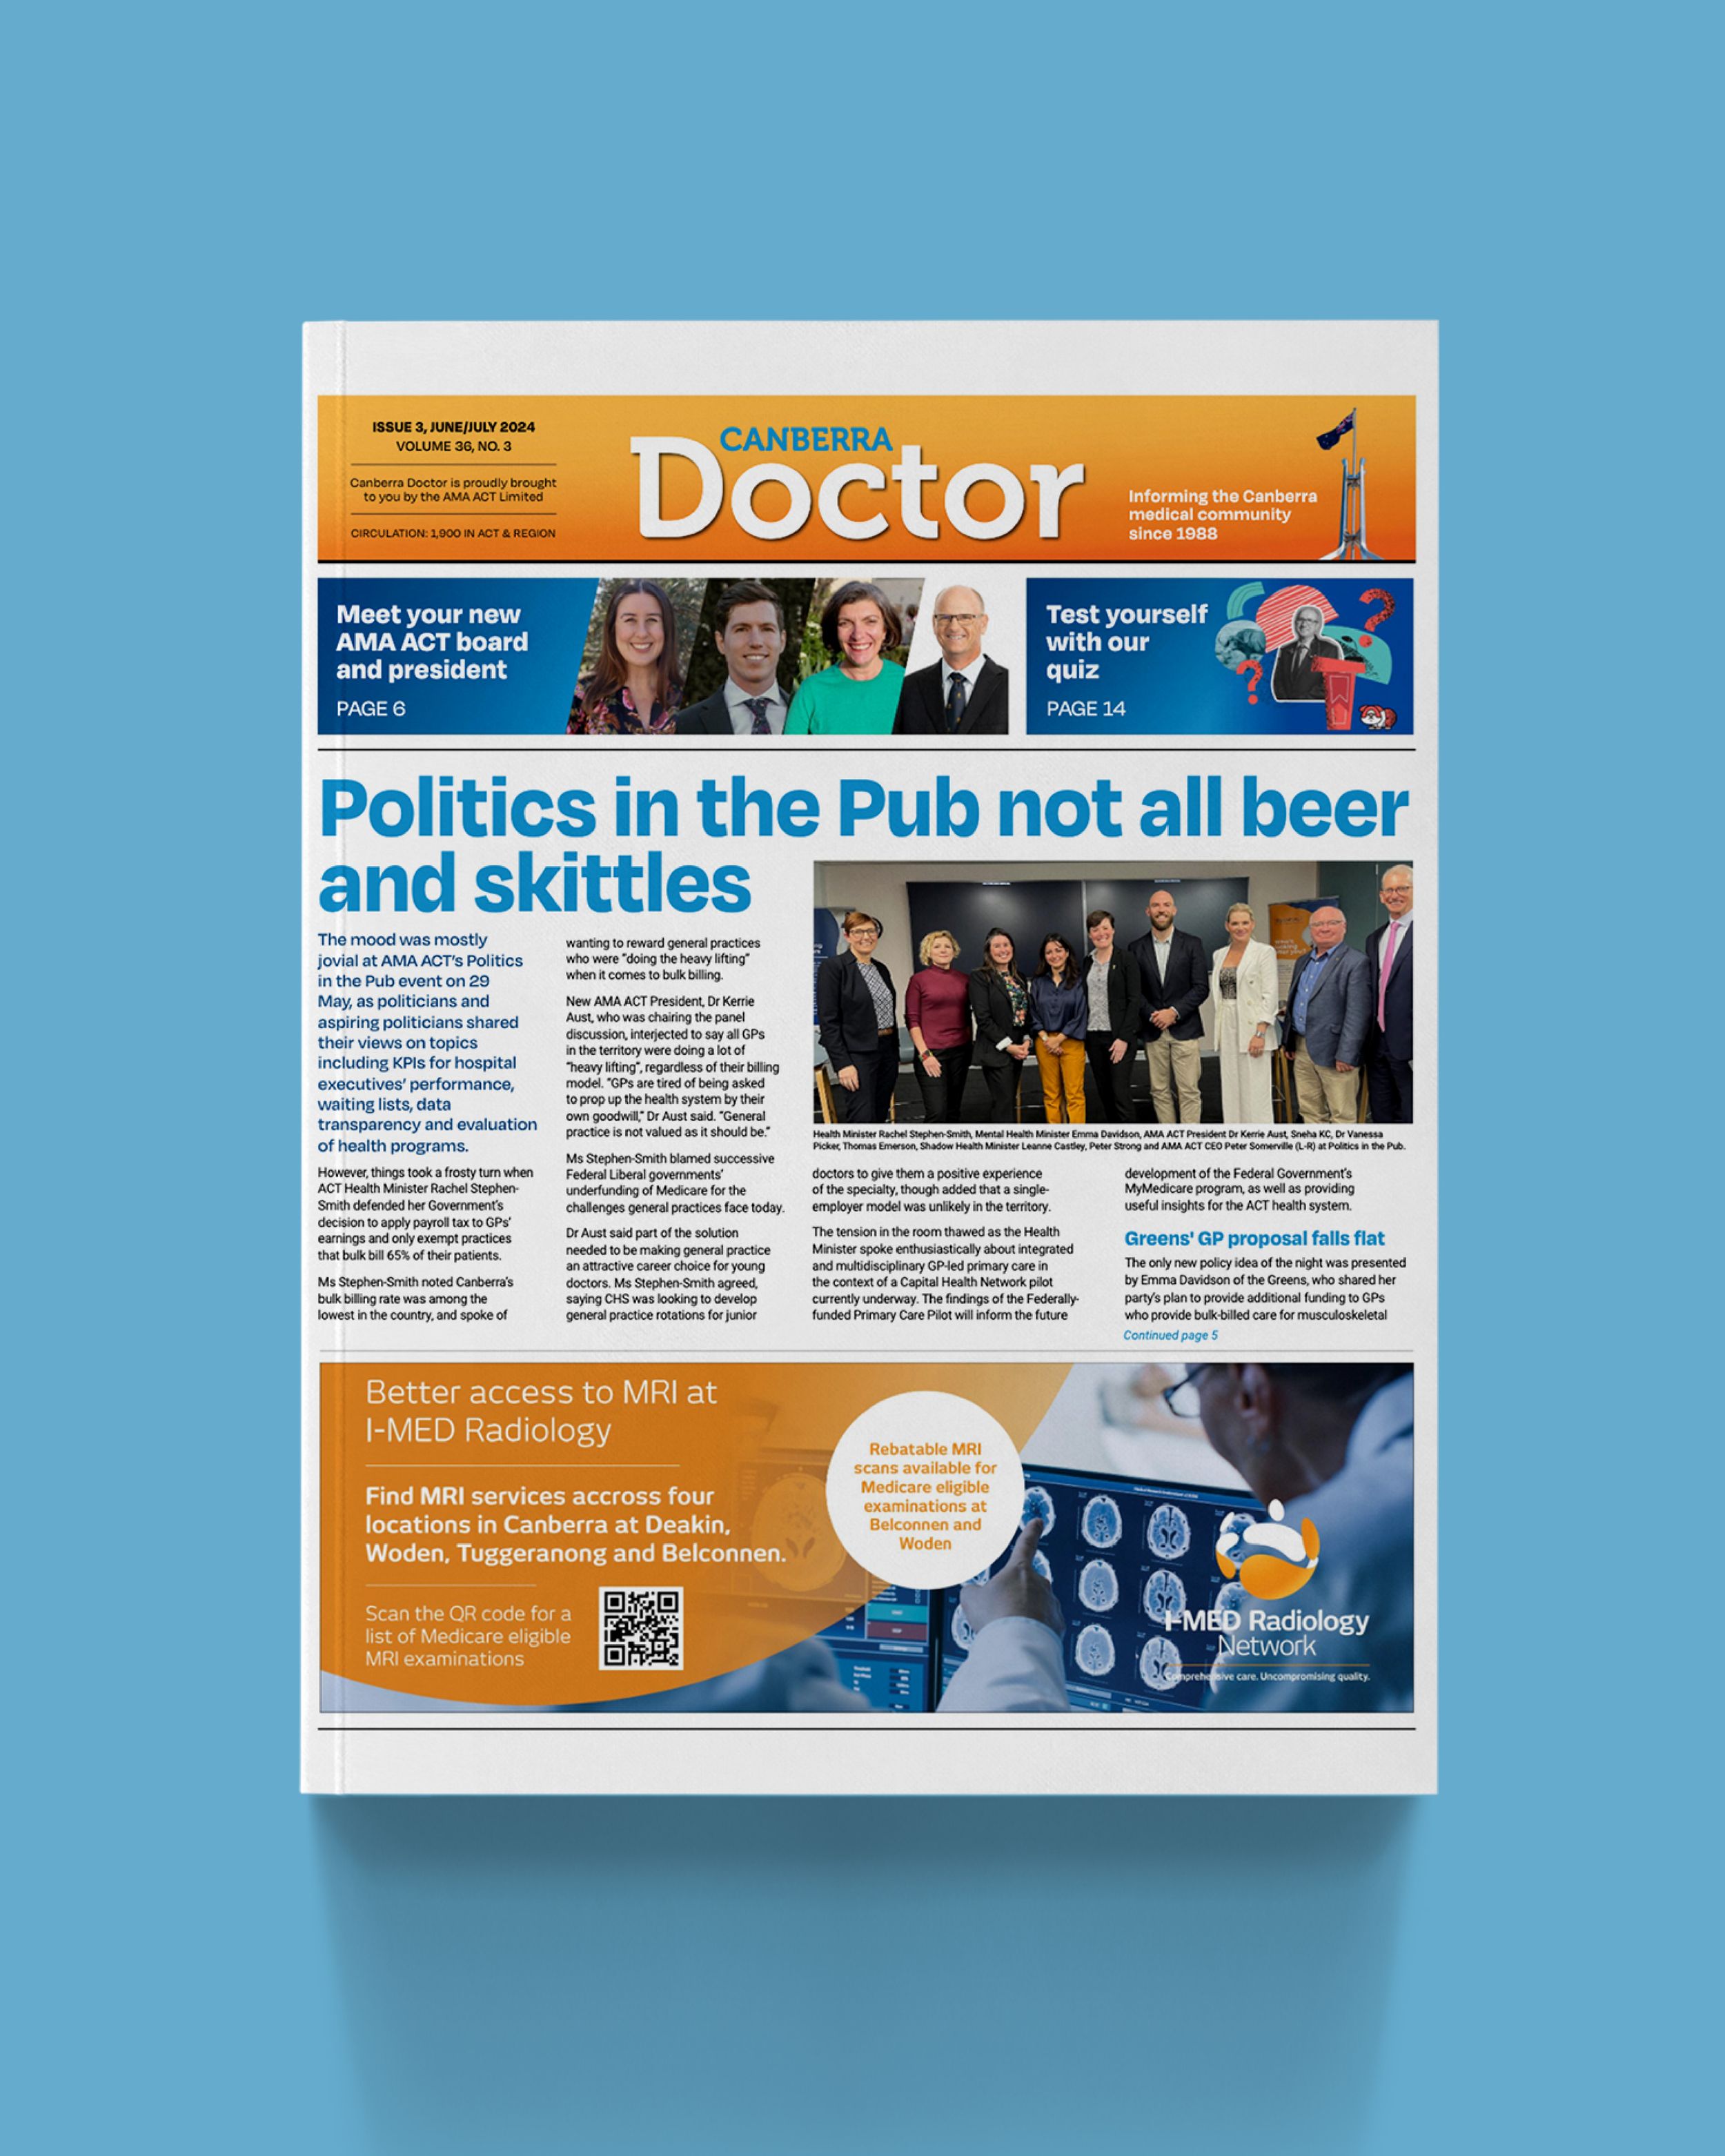
The Canberra Doctor Magazine
I had the opportunity to work with the Australian Medical Association (ACT) on a few issues of their Canberra Doctor magazine. My role involved following the established visual style to maintain consistency across editions, designing concept imagery that aligned with their existing aesthetic, and optimising layouts for both print and digital use. This project also allowed me to further develop my layout and typesetting skills, ensuring each page felt cohesive, engaging, and easy to navigate.